
Analysis of Supervised Learning Algorithms
Core Concepts and Methodology
The Learning Process
Supervised learning functions by adjusting a model's internal parameters to minimize the discrepancy between its predictions and actual labels. This iterative process is divided into several stages:
Training: Feeding labeled data to an algorithm to develop a mathematical representation (the model) of the feature-label relationship.
Prediction vs. Inference:
Prediction focuses on generating actionable outputs (e.g., forecasting a stock price).
Inference focuses on interpreting the underlying structure and relationships between variables (e.g., determining which feature is most influential in a decision).
Evaluation: Assessing performance using metrics such as Accuracy (proportion of correct predictions), Precision, Recall, and the F1-score (the harmonic mean of precision and recall).
Model Optimization and Generalization
To ensure a model performs well on real-world data, developers utilize specific techniques:
Cross-Validation: Splitting data into multiple "folds" to train and validate the model on different subsets, providing a reliable estimate of performance.
Regularization: Adding a penalty to the loss function to discourage over-complexity.
L1 Regularization: Penalty based on the absolute value of coefficients.
L2 Regularization: Penalty based on the square of the coefficients.
Detailed Examination of Regression Algorithms
Linear Regression
Linear regression establishes a linear relationship between a continuous target variable and one or more predictors. The relationship is expressed as:
Simple Linear Regression: y=mx+c
Multiple Linear Regression: y=b0+b1x1+b2x2+...+bnxn
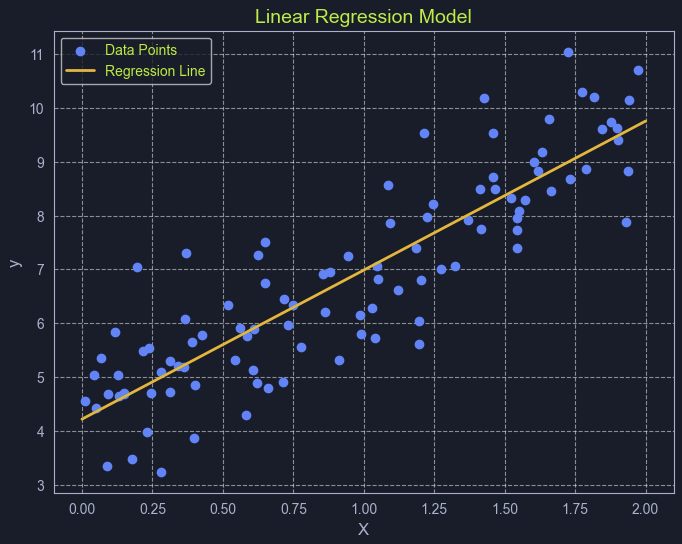
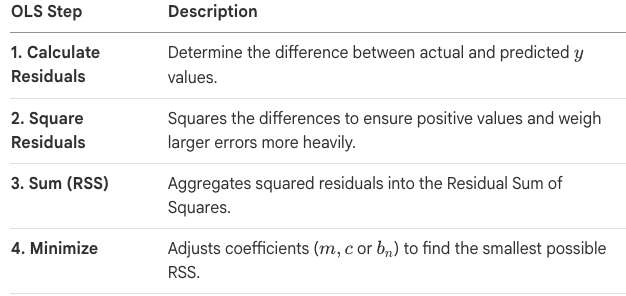
The standard method for optimizing these models is Ordinary Least Squares (OLS).
Key Assumptions:
Linearity: The relationship between variables is a straight line.
Independence: Observations are not dependent on one another.
Homoscedasticity: Error variance is constant across all predictor levels.
Normality: Errors follow a normal distribution.
Detailed Examination of Classification Algorithms
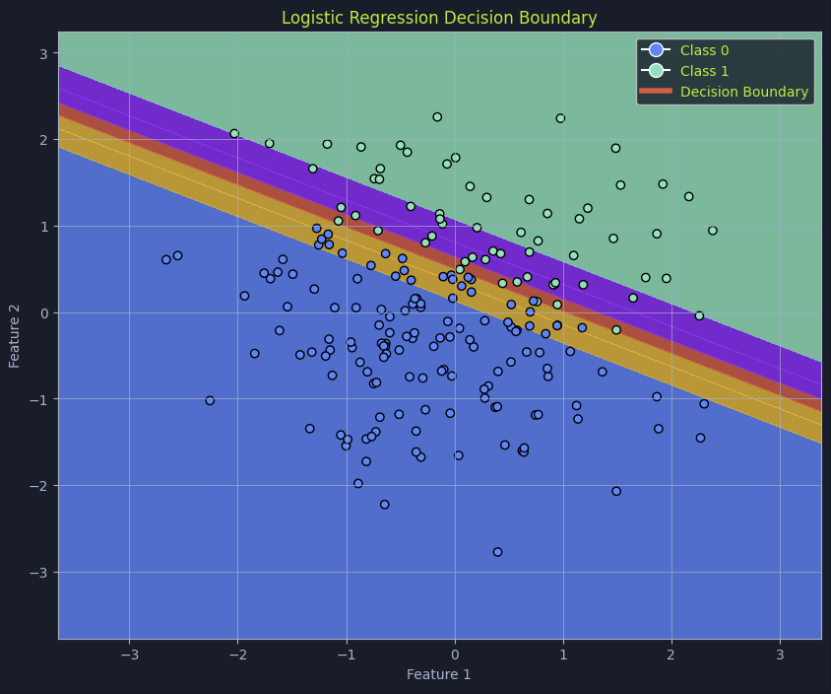
Logistic Regression
Despite its name, this is a classification algorithm used for binary outcomes (0 or 1). It uses a Sigmoid Function to map any input into a probability score between 0 and 1.
Sigmoid Formula: P(x)=1/(1+e^(−z))
Decision Boundary: A threshold (often 0.5) is set to determine class membership. If P(x) exceeds the threshold, it is classified as the positive class.
Hyperplane: In higher dimensions, the decision boundary is represented as a "flat" subspace that divides data into two regions.
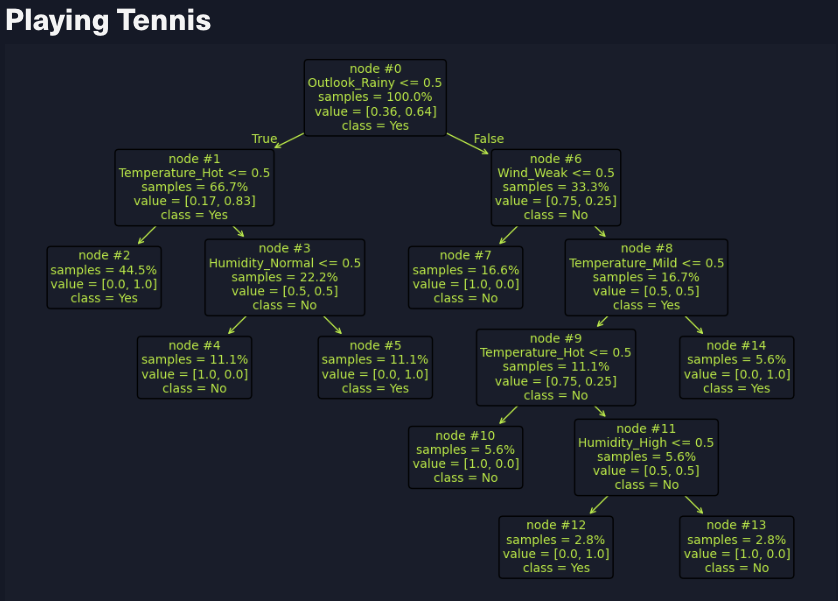
Decision Trees
Decision Trees utilize a tree-like structure of simple rules inferred from data features. They consist of a Root Node (the start), Internal Nodes (feature-based splits), and Leaf Nodes (terminal predictions).
Building Metrics:
Gini Impurity: Measures the probability of misclassifying a random element.
Entropy: Measures the disorder or uncertainty in a dataset.
Information Gain: The reduction in entropy achieved by splitting on a specific feature.
Stopping Criteria: The tree stops growing when it reaches a maximum depth, a minimum number of data points per node, or when nodes become "pure" (all points belong to one class).
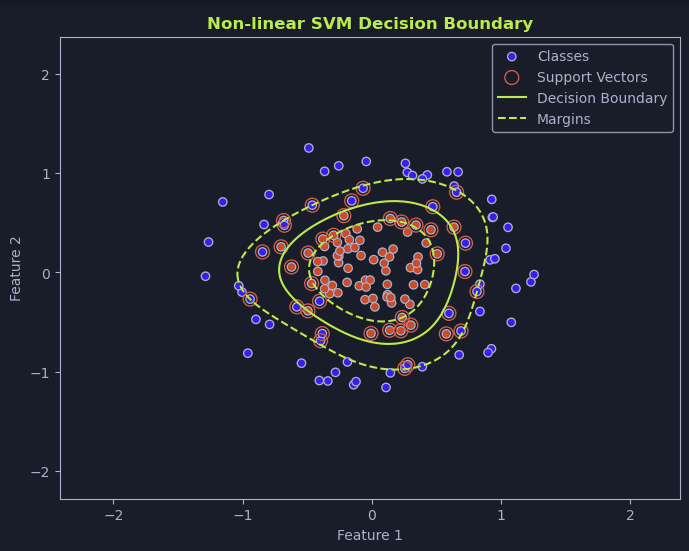
Support Vector Machines (SVMs)
SVMs are designed to find the optimal hyperplane that maximizes the margin—the distance between the hyperplane and the nearest data points, known as support vectors.
Linear SVM: Used when data is perfectly separable by a straight line.
Non-Linear SVM & The Kernel Trick: When data is not linearly separable, SVMs use kernel functions to map data into higher-dimensional spaces where a linear separator can be found.
Polynomial Kernel: Captures non-linear relationships using polynomial terms.
Radial Basis Function (RBF): A versatile kernel using a Gaussian function.
Sigmoid Kernel: Maps data with a sigmoid-shaped boundary.
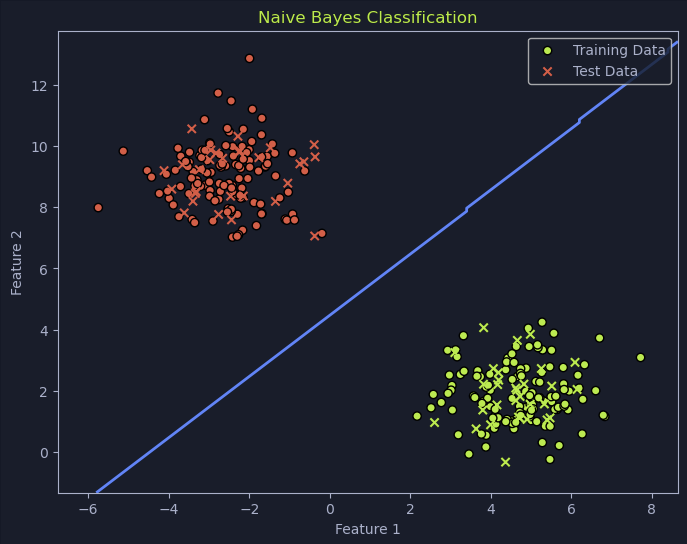
Naive Bayes
Naive Bayes is a probabilistic classifier based on Bayes' Theorem. It calculates the probability of an event occurring based on prior knowledge and observed evidence. It is noted for its efficiency and effectiveness in text-based tasks like spam filtering and sentiment analysis.